
FNIRSl-10140 is a two in one oscilloscope and signal generator launched by FNIRSI, with comprehensive functions and high practiccibility. It is a cost-effective dual channel desktop oscilloscope for the maintenance industry and R&D industry. The oscilloscope has a real-time sampling rate of 1 GSa / s (giga samples), 100MHz* 2 analog bandwidth; complete trigger function (single time / normal / automatic), both for periodic analog signal and aperiodic digital signal can be used freely; built in DDS function signal generator and the industry’s original chopping output (@ 2.5VPP), all signal frequency step is 1Hz. support 14 kinds of standard function signal and a customizable chopping signal, chopping the output device intercepts part or the whole part of the complex signals measured by the oscilloscope as the output signal of the signal generator, which can store up to 1000 customized cut-off signals; the built-in high-voltage protection module can tolerate up to 400 continuous voltage, without worrying about the oscilloscope booming accident caused by the probe not moving to 10x gear. Large time base scrolling mode, which can monitor the slow level change; equipped with efficient one button auto, seIf-adaptive 25%, 50%, 75% trigger, which can display the measured waveform without complicated adjustment; the display is equipped with 7-inch 800 * 480 resolution high-definition LC screen; cursor measurement function, which can read the amplitude and frequency parameters manually without reading the background scale unit and quantity, and without conversion To get the peak and frequency directly; extremely convenient screen capture and waveform storage function, built-in 1GB storage space, cim store up to 1000 screen capture pictures + 1000 groups of waveform data, the storage process is simple and fast, save the current waveform, just a click to save the current data, very convenient; powerful waveform image manager, support thumbnail browsing, view, view details The functions of page turning, deleting and waveform enlarging, reducing and moving are convenient for secondary analysis. The fu is equipped with USB interface, which can be connected with the computer to realize the sharing of its own screen capture pictures and the computer, which is convenient for secondary analysis; Lissajous graphic display function can be used to compare and judge the amplitude, frequency and phase of two groups of signals; FFT viewing function can roughly estimate the harmonic component of the signal; Lissajous graphic display function can be used to compare and judge the amplitude, frequency and phase of two groups of signals
!
1: When the two channels are used at the same time, the ground clamps of the two probes must be connected. It is strictly forbidden to connect the ground clamps of the two probes to different potentials, especially the different potential terminals of high-power equipment or 220 v. otherwise, the oscilloscope mother board will be bumped. Because the two channels are grounded together, connecting to different potentials will lead to the short circuit of the internal ground wire of the motherboard, and all oscilloscopes are same;
2: The BNC input of oscilloscope can withstand 400 voltage at most. It is strictly forbidden to input more than 400 voltage in the position of 1x probe
3: The original power supply must be used It is strictly forbidden to use the power supply or USB of other devices under the Otherwise, the motherboard ground wire may be short circuited during the test
4: 100 x
probe (such as ultrasonic welding machine, ultrasonic cleaning Machine etc.) or even 1000x probe (such as high-voltage end of high-frequency transformer, coil of induction cooker, etc.) must be used to measure high-frequency and high-voltage signal.
Solemnly remind
the bandwidth of 1x probe is 5MHz, and the bandwidth of 10x probe is 100MHz.
When the measurement frequency is higher than 5MHz, the switch on the probe handle needs to be moved to 10x, and the oscilloscope also needs to be set to 10x.
Otherwise, the signal will be greatly attenuated, which is the case with all oscilloscopes.
Because the probe line of the oscilloscope itself has a capacitance as high as 100 – 300pf, which is a big capacitance for high frequency signal! The signal has been greatly attenuated when it reaches the input end of the oscilloscope through the probe, and the equivalent bandwidth is 5 MHz. Therefore, in order to match the hundreds of PF of the probe line, the input end of the probe line will be attenuated 10 times (the switch is in the 10x gear), so that the hundreds of PF capacitor is just used for impedance matching. At this time, the bandwidth is 100MHz. Note that only
probes with 100MHz bandwidth or above can be used
Interface function indicator diagram
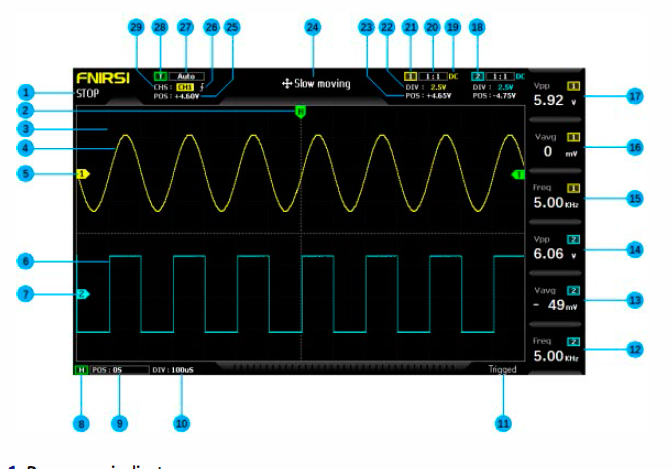
1: Run pause indicator
2: The trigger x position indication arrow indicates that this is the trigger x point
3: Background grid tick marks
4: Waveform data of channel 1
5: The baseline position of channel 1 indicates the arrow, that is, the position of OV potential
6: Waveform data of channel 2
7: The baseline position of channel 2 indicates the arrow, that is, the position of 0V potential
8: Horizontal time base control bar flag
9: Trigger the position of the X arrow relative to the system coordinate system
10: Horizontal time base refers to the length of time represented by a large grid in the horizontal direction, which is determined by the sampling rate. The larger the time base is, the slower the sampling rate is, and vice versa
11: Trigger status flag
12: Column 6 measurement parameters, press F6 to select measurement parameters freely
13: Column 5 measurement parameters, press FS to select measurement parameters freely
14: Column 4 measurement parameters, press F4 to select measurement parameters freely
15: Column 3 measurement parameters, press F3 to select measurement parameters freely
16: Column 2 measurement parameters, press F2 to select measurement parameters freely
17: Column 1 measurement parameters, press F1 to select measurement parameters freely
18: Channel 2 control bar sign
19: The input coupling mode of channel 1 has two options: DC and ac. DC means DC coupling and AC means AC coupling
20: Channel 1 probe magnification
21: Channel 1 control bar sign
22: vertical sensitivity of channel 1 refers to the voltage represented by a large grid in the vertical direction
23: Channel 1 baseline arrow position relative to the system coordinate system
24: movement speed of waveform operation, fast movement is used for coarse adjustment, and slow movement is used for fine adjustment
25: trigger voltage arrow position relative to the system coordinate system
26: trigger edge indicator, arrow up to rising edge trigger, arrow down to falling edge trigger
27: trigger mode indicator, divided into auto, single and normal; auto is automatic trigger, single is single trigger and normal is normal trigger
28: trigger control bar flag
29: trigger channel, divided into ch1 and CH2 options
Button function indication diagram
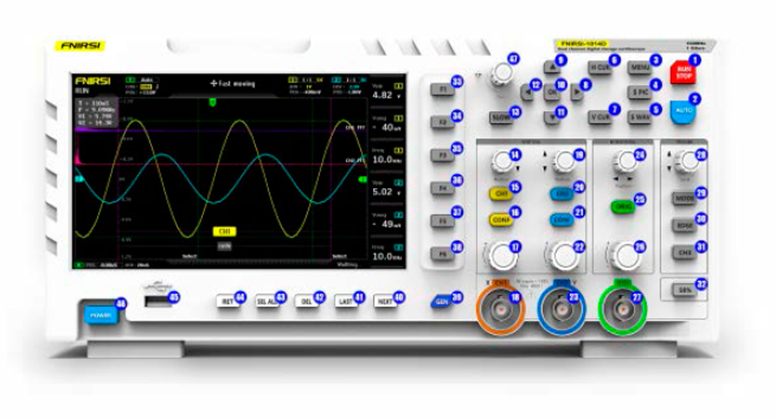
l pause button. Click. this button to pause sampling at any time
2: One key automatic adjustment button, click. this button, the system will automatically
identify the signal and set the system to the best parameters to display this waveform
3: Function menu button, click. hereto pop up the function menu
4: One click. screen capture button. Click. this button to take a screen capture of the
whole screen and save it to the interna! storage space automatically
5: One button save waveform button, click. this button will save all waveform data of
the two channels to the interna! storage space
6: Time cursor switch button, click. this button to turn on and off the cursor measurement
function
7: Press the voltage cursor switch keyto turn on and off the cursor measurement
function
8: System [right] navigation key
9: System navigation key
1 O: System [OK] navigation key
11: System navigation key
12: System [left] navigation key
13: Move speed button. Click. this button to switch between fast move and slow move
14: Channel 1 vertical position adjustment knob, rotate clockwise to move up, rotate
counterclockwise to move down
15: Channel 1 switch button. Click. this button to turn on or off the waveform display
of channel 1
16: Channel 1 control bar button. Click this button to pop up the control parameters
related to channel 1, which can be selected according to the navigation key or the
knob next to it
17: Channel 1 vertical sensitivity adjustment knob, clockwise vertical amplification,
counterclockwise vertical reduction
18: Channel 1 signal input port, the measurement range is O – 40V peak. to peak., pay
attention to the maximum tolerance of 400V peak. to peak. withstand voltage
19: Channel 2 vertical position adjustment knob, rotate clockwise to move up, rotate
counterclockwise to move down
20: Channel 2 switch button. Click this button to turn on or off the waveform display
of channel 2
21: Channel 2 control bar button. Click. this button to pop up the control parameters
related to channel 2, which can be selected according to the navigation key or the
knob next to it
22: Channel 2 vertical sensitivity adjustment knob, clockwise vertical amplification,
counterclockwise vertical reduction
23: Channel 2 signal input port. the measurement range is O – 40V peak. to peak., pay
attention to the maximum tolerance of 400V peak to peak withstand voltage
24: the system triggers the x position adjustment knob to move clockwise to the rig ht
and counterclockwise to the left
ZS: one key return to center button, after clicking this button, channel 1, channel 2
vertical position, trigger x horizontal position, trigger y vertical position will return to
center
Z6: the time base adjustment knob is rotated clockwise to reduce the time base, that
is, to enlarge the waveform horizontally, and counterclockwise to increase the time
base, that is, to reduce the waveform horizontally
Z7: DOS signal generator output
ZB: trigger voltage y position adjustment knob, rotate clockwise to move up, rotate
counterclockwise to move down
Z9: trigger mode switch button, divided into auto, single and normal
30: trigger edge switch button, divided into rising edge and falling edge
31: trigger channel switch button, divided into channel 1 and channel 2
32: 50% trigger button, click this button, the system will automatically set the current
trigger voltage to 25%, 50%, 75% according to the signal characteristics to trigger
33: the first column measurement parameter selection button, after the measurement
block diagram pops up, you can select according to the navigation key or the knob
next to it
34: the second column measurement parameter selection button, after the measurement
block diagram pops up, you can select according to the navigation key or the
knob next to it
35: the measurement parameter selection button in column 3, after the measurement
block diagram pops up, you can select according to the navigation key or the knob
next to it
36: the measurement parameter selection button in column 4, after the measurement
block diagram pops up, you can select according to the navigation key or the knob
beside it37: the measurement parameter selection button in column 5 pops up the
measurement block diagram, which can be selected according to the navigation key
or the knob beside it
38: the measurement parameter selection button in column 6, after the measurement
block diagram pops up, you can select according to the navigation key or the knob
beside it
39: signal generator control bar button, click this button will pop up the signal
generator parameter control bar, you can select according to the navigation key or
the knob next to it
40: next page of the control button on the next page of picture / waveform /
chopping Manager
41: picture l wave form l chopped wave manager next page control button [previous
page]
42: [delete] of the control button on the next page of picture l waveform l chopping
Manager
43: select a 11 of the control buttons on the next page of picture l waveform l chopping
Manager
44: [retum] of the control button on the next page of picture l waveform chopping
Manager
45: USB port for sharing screenshots
46: power switch, click to start or shut down operation
Operating instructions [oscilloscope part]
Open or close channel 1 / Channel 2:
click [ch1] / [CH2] to open or dose ch1 l CH2
Tum FFT on or off: click the [conf] button under ch1 or CH2, the parameter control bar
of channel 1 / Channel 2 will pop up, and then turn FFT on / off through the navigation
key
Setting input coupling mode:
click [conf] under ch1 or CH2 to pop up the parameter
control bar of channel 1 l Channel 2, and then switch DC l AC trough the navigation
key
Set the probe input ratio:
click [conf] under ch1 or CH2, the parameter control bar
of channel 1 l Channel 2 will pop up, and then switch to 1 x l 1 Ox / 1 OOx through the
navigation key
Scaling waveform: rotate the large knob at the bottom left corner of vertical frame
to scale the waveform of channel 1 vertically, and rotate the large knob at the bottom
right corner to scale the waveform of channel 2 vertically; rotate the large knob at the
bottom of horizontal frame to scale the waveform of channel 1 and channel 2
horizontally, clockwise to enlarge, counterclockwise to reduce
Moving waveform:
rotate the small knob in the upper left corner of vertical frame to
move the waveform of channel 1 vertically, and rotate the small knob in the upper
right corner to move the waveform of channel 2 vertically, which moves clockwise
upward and counterclockwise downward; rotate the small knob in the upper horizontal
frame to move the waveform of channel 1 and channel 2 horizontally, which moves
clockwise to the right and anticlockwise to the left In the process, you can click the
[slow] button to select coarse adjustment or fine adjustment
Adjust trigger voltage:
rotate the small knob under the trigger frame to adjust the
trigger voIta ge. In this process, you can click the [slow] button to select coarse adjustment
or fine adjustment. Pay attention to tum off the [automatic 50%] trigger in the
men u fi rst, otherwise the trigger voltage can not be adjusted
Set trigger edge:
click edge to switch rising edge l falling edge
Set auto trigger:
click mode to switch between auto l single l normal, where auto is
auto trigger
Set single trigger:
click mode to switch between auto l single l normal, where single
is single trigger
Set normal trigger: click mode to switch between auto l single l normal, where
normal is normal trigger
Pause display:
click the red [run l stop] button in the upper right corner to pause or
run
Automatic waveform adjustment: click the blue [auto] button in the upper right
corner to adjust automatically
Set the slow scan scrolling mode: rotate the big knob under the horizontal frame
counterclockwise. When the base reaches 1 OOms, the system will enter the slow scan
scrolling mode. 1 OOms – 50s belong to the time base of the scrolling mode
Time cursor measurement
click the [H cur] button to turn on the time cursor, and
then select the left and right light markings by the left and right keys of the navigation
key, and finally adjust them by the small knob in the upper left corner of the navigation
key, in which the light markings are moved to the right by clockwise rotation and
to the left by counterclockwise rotation
Voltage cursor measurement
click the [v cur] button to tum on the voltage cursor,
and then select the up and down light marking lines by the up and down keys of the
navigation key, and finally adjust them by the small knob in the upper left corner of
the navigation key, in which the light marking lines are moved upward by clockwise
rotation and downward by counterclockwise rotation
Set the parameters to be displayed:
click F1 – F6 to pop up the parameter measurement
control bar, and select the currently required parameters through the navigation
key or the nearby knob
Full screen capture:
click the [s pic] button to capture the current display. The
captured image is saved to the local disk in BMP format
s.va current waveform data: click the [s wav] button to save all waveform data of
the opened channel to the local disk
Adjust the screen brightness:
click the [menu] button, navigate to the [screen
brightness], press the OK key, and finally adjust the screen brightness through the
small knob in the upper left corner. 100 is the brightest and O is the darkest
Adjust the background grid brightness:
click the [menu] key, navigate to the [grid
brightness], press the OK key, and finally ad just t he grid brightness through the smal l
knob in the upper left corner. 100 is the brightest, and O is to turn off the grid display
Setting automatic 50% trigger all the time: click the [menu] key, navigate to
[automatic 50%], press the OK key, and then select [on] through the navigation key.
After setting, in the automatic trigger mode, each measurement system will automatically
set the trigger voltage to 25% / 50% / 75% of the peak to pea k value according
to the waveform characteristics
Horizontal baseline offset calibration:
when the probe has been pulled out, when
the left yellow l cyan indicator arrow and the Yellow l cyan horizontal baseline of
either channel are not in the same position, calibration is required; first pull out the
probe, then click the [menu] key, navigate to [baseline calibration], and then press the
OK key to calibrate the baseline
View the saved screen capture:
click [menu], navigate to [picture browse], and then
press the OK key to enter the picture thumbnail preview interface, which is the
thumbnail of the captured waveform. Select the thumbnail through the navigation
key, and then click [OKJ to view the screen capture of the waveform in full screen, with
(RET) return at the bottom, (SEL) All), (DEL), Oast), (next) the next control button can
be operated
View the saved waveform data:
click [menu] key, navigate to [waveform browse].
and then press the OK key to enter the waveform thumbnail preview interface, where
is the waveform thumbnail. Select the thumbnail through the navigation key, and
then click [OK] to view the waveform in full screen, with (REn retum at the bottom,
(SEL) All), (DEL), (last), (next) the next control button can be operated
Delete the saved waveform:
click the [menu] key, navigate to [waveform browse],
and then press the OK key to enter the waveform thumbnail preview interface, where
is the waveform thumbnail. Select the thumbnail through the navigation key, and
then click the [del] key at the bottom to delete the waveform, or click the key to delete
it in full screen view
Connect the computer to view the screen capture pictures:
click the [menu] button,
n¡¡vigate to the [USB share] through the navigation key, and then press the OK key to
open the USB share. Then connect the computer with the attached USB cable, and the
computer will pop up the removable disk or U-disk. Vau can find the screen capture
pictures saved in the disk in the computer. Note that you can’t repair them directly in
the disk Change the file name of the picture, otherwise the oscilloscope picture
manager will not be able to display the Picture
Operation instruction [signal generator part]
Switch the waveform type:
click the [Gen] button, the signal generator control
interface will pop up in the lower right corner of the screen, and then click the [OK]
button to switch the green selection box to the [waveform type] position, and then
click the [up] or [down] in the navigation key or the button in the upper left corner of
the navigation key to switch the waveform type
Adjust the waveform frequency:
click the [Gen] button, the sign¡il generator control
interface will pop up in the lower right corner of the screen, and then click the [OK]
button to switch the green selection box to the [frequency] position, and then click
the [left] or [right] in the navigation key to set the position cursor, that is, to set the
division to be adjusted. After confirming, press the [up] or [down] or the [up] button
in the upper left corner of the navigation key The knob can increase or decrease the
val u e of the current bit, thus changing the frequency
Adjust the duty cycle of square wave:
the duty cycle setting is only effective for
square wave. It can only be set when the waveform type is square wave. Other
waveforms h¡ive no concept of duty cycle. Click the [Gen] button, the signal generator
control interface will pop up in the lower right corner of the screen, and then click the
[OK] button to switch the green selection box to the [duty cycle] position, and then
rotate the navigation key in the upper left corner Vau can increase or decrease the
duty cycle with the knob of 1 % – 99%
Capture waveform:
Capture waveform output is to capture part or the whole part of
the current displayed waveform as the output of signal generator. The captured signa l
can be saved to the system, and up to 1000 groups of captured signals can be saved.
First. click the [menu] button, the function interface will pop up on the left side of the
screen, and then locate it to the capture output] position through the navigation key
and open it on the screen Two purple boundary lines will pop up. The waveform
within the two boundary lines is the waveform segment to be captured .The word
select indicates that the boundary line is the boundary line operated by the current
knob. You can switch and select the current operation line through the [left] and
[right] keys of the navigation key. After setting the boundilry line, you can go up to
the left through the navigation key When adjusting, you can click the [slow] key to set
coarse and fine adjustment; there is a word ‘channel 1 l Channel 2’ in the middle of
the two boundary lines, which means that the current captured signal is channel 1 l
Channel 2 signal, and you can select the channel through the [up] [down] of the
navigation key; the left boundary line is marked with voltage scale, which is used to
refer to the captured wave If you want to adjust the chopping level position, you can
adjust the offset by adjusting the Y position of the channel. For example, if you
captured a DC signal and adjust the DC waveform to+ 1V position, then the output
is + 1V voltage, and adjust to – 1V, then the output is – 1V voltage; If you want to
ildjust the sa m pi i ng ¡¡m plitude of chopped wave, you can adjust the verticil l sensitivity
of the channel to scale the waveform vertically. It is recommended to first amplify the
signal amplitude to the maximum, but not to cut the top, and then capture so that the
output signal will have enough sampling data, the output waveform distortion will be
smaller. and the resolution will be higher. If you only capture a very small signal, and
then capture it Output, and then through the oscilloscope meilsurement to enlarge it,
the waveform will appear a very serious ladder phenomenon, because the sampling
is insufficient, the effective signal is too little, just like the original image is very small,
but fon::ed to enlarge, the image is bound to be fuzzy; after all the parameters are
determined, click the [OKJ key, the cut-off will be saved to the system disk
Output the captured waveform as the signal generator:
first click the [Gen] button
to open the signa l generator interface, then click the [OK] button to switch the green
selection box to the [waveform type] position, and then click the [up] and [down] in
the navigation key to switch it to ‘self definition’, then click the [Gen] button to exit
the signal generator control interface, and then click the [ M ENU] button , the function
interface will pop up on the left side of the screen, and then navigate it to the [output
browsing] position and open it All saved captured signals will be listed on the screen,
and then the selection box will be moved to the desired signal position through the
navigation key. Click the [OKJ key, and the Yellow word ‘output’ will pop up in the
upper left corner of the w¡¡veform, which means that the current custom sign¡¡I
selection bit of the waveform Then click [menu] to exit, and the waveform output by
the signal generator is the captured signal. It should be noted that if the captured
waveform is a single cycle waveform, that is, there is only one cycle in the two bound
ary lines, then the output frequency of the signal generator is equal to the frequency
set by the signal generator. If the captured waveform frequency contains N cycles,
then the output frequency of the signal generator is n times of the set frequency, and
the trigger voltage should be adjusted to the minimum edge of the waveform In
other words, the intersection paint between the waveform and the trigger line is the
least:. otherwise the displayed frequency may be several times of the actual frequency,
because the calculated frequency of the oscilloscope is the frequency obtilined by
calculating the number of edges from the trigger line, so the wrong edge of the
positioning may also lead to frequency doubling
Analysis of common problems
1: Why can’t I turn on the machine after receiving it?
Answer: please check whether the power cord is connected to the oscilloscope and
whether the socket is powered. If all are correct. please replace a mobile phone
charging head and test it. If it is still unable to start. please contact customer service for replacement
2: Why Is there no waveform In the test, only one line on the screen Is still?
Answer: please check whether the pause has been pressed. If not. press the [auto]
button once. If not. it may be a problem that the signal source has no signal output.
or the probe line may be short circuited or open circuit. Please check whether the
probe and signal source are normal with multimeter
3: Why is the voltage value data 0?
Answer: please adjust the vertical sensitivity and time base (sampling rate), or press
[auto] screen to display at least a clear and complete periodic waveform, and the top
and bottom of the waveform should be displayed on the screen completely without
cutting the top. The voltage value data is correct at this time
4: Why is the frequency value data 0?
Answer: first. it is necessary to ensure that the trigger mode is auto automatic triggering.
if it is still O in auto mode, press [auto] button once. At least a clear and complete
periodic waveform is displayed on the screen, and the waveform should be triggered
(the green arrow indicates that the position is fixed between the wave shape and the
wave shape without shaking). The data of frequency value is correct
5: Why is the duty cycle 0?
Answer: first. it is necessary to ensure that the trigger mode is auto automatic triggering.
If it is still O in auto mode, it may be that the trigger is not adjusted to the
waveform. After the trigger line is adjusted to the waveform, the waveform will be
fixed. Moreover, the data of duty cycle will be correct only after at least one clear
periodic waveform is displayed on the screen
6: Why is AC coupling the same as DC coupling waveform?
Answer: if the input signal is a symmetrical AC signal (such as domestic 220V}, the AC
coupling or DC coupling waveform are the same. If it is an asymmetric AC signal or a
DC pulse signal, the waveform will move up and down when the coupling is switched
7: Why does the wavefonn run up and down when testing the signal, and can’t
see the wavefonn only see multiple online and offline beats?
Answer: set trigger mode to auto auto trigger, and then press [auto] button once. If it
is not solved, the clamp on the probe may not be grounded or the probe clamp end
is open circuit. Please check whether the probe is normal with multimeter
8: Why does the test wavefonn shake around and cannot be futed?
Answer: the trig g e r voltage needs to be adjusted, this is, the green arrow on the right
needs to adjust the green indicator to the top and bottom of the waveform. The
waveform is triggered and fixed, or the setting menu is entered to turn on «automatic
50%.’
9: Why can’t we capture sudden pulse waves or digital logic signals?
Answer: adjust the trigger mode to ‘Normal» or «Single’, then adjust the trigger
voltage and time base and vertical sensitivity, and finally touch the pause.
1 O: Why does trigger voltage regulation not respond?
Answer: click menu – Auto 50% to dose it
11: Why do you measure a battery or other DC voltage with out waveform?
Answer: battery voltage signal is stable DC signal, there is no curve waveform, in DC
coupled mode, and then adjust vertical sensitivity, there will be an upward or
downward offset straight line waveform, if it is AC coupling, no matter how to adjust.
there is no waveform.
12: why do we measure the 220V power frequency 50Hz wave?
Answer: if the oscilloscope displays SOHz low frequency signal, the sampling rate
needs to be very low to capture SOHz signal. If the sampling r11te is low, the oscilloscope
will enter the waiting, so it will show «card change’. All oscilloscopes in the
world will change their cards when measuring SOHz signals, not because the oscilloscope
itseIf is stuck
13: Why is the peak value of VPP more than 600 V and not 220V or 31 OV when
measuring the voltage wave form of the city power?
Answer: the city power 220V is a symmetrical AC signal, the positive peak voltage
(maximum value) is +310v, the negative peak voltage (minimum value) is -310v, sothe
peak value is 620V, the switching parameter is the effective value. At this time, it
is often said that the voltage of 220V, the effective value of the municipal voltage
fluctuates from 180 to 260V, so the peak VPP is in the range of 507-733v
14: Why is the measured voltage of 220V not a standard sine wave, there is
distortion?
Answer: in the municipal power grid, there are generally pollution, and there are more
high-order harmonic components. These harmonies will show a distorted sine wave
and normal phenomenon when superimposed on the sine wave. Generally, the shape
of the city electric wave is distorted, and it is irrelevant to the oscilloscope itself
15: Why is there a large offset between the baseline (OV) and the left arrow COV
indication} on the screen under no 5ignal input?
Answer: first pull out the probe, then click [menu] button, navigate to [baseline
calibration], then press OK, and wait for baseline calibration to complete, the baseline
and arrow coincide
16: Why is the signal voltage above 5MHz measured attenuated significantly, and
the bandwidth is only 5MHz?
Answer: when measuring 5MHz or more, it is necessary to move the probe to 10x
gear and the oscilloscope should be set to 1 Ox input mode, because the probe line of
the oscilloscope has a capacitance of up to 100-300pf, which is a big capacitance for
high frequency signal! The signal has been greatly attenuated when it reaches the
input end of the oscilloscope through the probe, and the equivalent bandwidth is
SMHz. So in order to match hundreds of PF of probe line, it will be decayed 1 O times
at the input end of probe line (switch is in 10x), so that these hundreds of PF capacitors
are just used for impedance matching. At this time, the bandwidth is 100MHz.
Note that only the supporting 100 MHz probe can be used
Test methods of common circuits
Battery or DC voltage measurement
Gear selection: the battery voltage is generally below 40V, other DC voltage is
uncertain, so it is necessary to adjust the gear according to the actual situation. if it
is higher than 40V (both probe and oscilloscope are set to the same gear)
1: Firstly, the oscilloscope is set to auto trigger mode (auto trigger mode is default
after startup), and auto trigger mode is used to test the cycle signal (DC voltage
belongs to the periodic signal)
2: The oscilloscope probe multiplier is set to the corresponding gear (default is 1x
after startup)
3: Oscilloscope coupling mode is set to DC coupling mode
4: Insert the probe and move the switch on the probe handle to the corresponding
gear
5: Make sure the battery is powered or the DC voltage is voltage output
6: Connect the probe clip to the negative battery or the negative DC electrode, and
the probe to the battery or DC positive pole
7: Press [auto] once, the DC electrical signal will be displayed. Then, look at the
parameter of average value. Note that battery voltage or other DC voltage belong to
DC signal, and there is no curve waveform, only a line with up and down offset and
the peak value and frequency of this signal are O
Crystal vibration measurement
Gear selection: crystal oscillator is easy to stop oscillation after encountering capacitance.
input capacitance of 1x probe is up to 100-300pf, 10x gear is about 10-30pf,
and it is easy to stop vibration in 1x gear, so it is necessary to set 1 Ox gear, that is, both
probe and oscilloscope should be switched to 10x gear (probe and oscilloscope are
set to 10x gear)
1: Firstly, the oscilloscope is set to auto trigger mode (auto trigger mode is default
after startup), and auto trigger mode is used to test the periodic signal (the sine signa l
of crystal resonance belongs to the periodic signal
2: The oscilloscope probe multiplier is set to 10x (default is in the 1x gear after
startup)
3: Oscilloscope coupling mode is set to AC coupling mode
4: insert the probe and move the switch on the probe handle to 10x
5: Make sure the crystal board is powered on and running
6: Connect the probe clip to the ground wire of the crystal oscillator board (negative
pole of power supply), pull the probe cap out, and inside it is the needle tip, which
contacts one of the pins of the crystal oscillator
7: Press the [auto] button once to display the waveform of the crystal vibration tested.
If the waveform after automatic adjustment is too small or too large, the waveform
size can be adjusted manually by knob
PWM signal measurement of MOS tube or IGBT
Gear selection: the PWM signal voltage of direct drive MOS tube or IGBT is generally
within 10v-20v, the control signal of PWM front stage is also generally within 3-20v,
and the maximum test of 40V in the 1x gear is enough. Therefore, it is enough to
test the PWM signal with the 1x gear (both probe and oscilloscope are set to the 1x
gear).
1: Firstly, the oscilloscope is set to auto trigger mode (auto trigger mode is default
after startup), and auto trigger mode is used to test cycle signal (PWM belongs to
cycle signal
2: The oscilloscope probe multiplier is set to the 1x gear (default is 1x gear after
startup)
3: Oscilloscope coupling mode is set to DC coupling mode
4: insert the probe and move the switch on the probe handle to the 1x position
5: Make sure that the PWM main board has PWM signal output at this time
6: Clip the probe to the S-pole of the MOS tube and the probe to the g-pole of the
MOS tube
7: Press the [auto] button once to display the measured PWM waveform. if the
waveform after automatic adjustment is too small or too large, the waveform size can
be adjusted manually by knob
Signal generator output measurement
Gear selection: the output voltage of signal generator is within 30V, and the maximum
test value of 1x gear is 40V, so the output of test signal generator is in the 1x gear
(probe and oscilloscope are set to be 1 x gear).
1: Firstly, the oscilloscope is set to auto trigger mode (the default mode is auto trigger
mode after startup), and auto trigger mode is used to test the periodic signal (the
signal output by the signal generator belongs to the periodic signaO
2: The oscilloscope probe multiplier is set to the 1x gear (default is 1x gear after
startup)
3: Oscilloscope coupling mode is set to DC coupling mode
4: insert the probe and move the switch on the probe handle to the 1x position
5: Make sure the signal generator is on and is outputting the signal
6: Connect the probe clip to the black clip of the signal generator output line, and the
probe to the red output line of the signa l generator
7: Press the [auto] button once, the waveform output by the generator will be
displayed. If the waveform after automatic adjustment is too small or too large, the
waveform size can be adjusted manually by knob
Measurement of domestic electricity at 220V or 110V
Gear selection: first, you need to buy 1 OOx probe; household electric power generally
180-260V, peak peak voltage is 507-733v, the maximum measurement of 1x is 40V,
the highest val u e of 1 Ox is 400V, 1 OOx is 4000V, and the default standard probe is 1 Ox
high voltage probe, and the peak value of 400V can only be measured. Therefore,
1 OOx probe shall be provided by itseIf, and then set to 1 OOx gear, that is, both probe
and oscilloscope shall be switched to 1 OOx gear
1: Firstly, the oscilloscope is set to auto trigger mode (auto trigger mode is default
after startup), and auto trigger mode is used to test the cycle signal (50Hz of household
electric power belongs to the periodic signal)
2: The oscilloscope probe multiplier is set to 100x (default is in the 1x gear after
startup)
3: Oscilloscope coupling mode is set to AC coupling mode
4: insert the probe and move the switch on the probe handle to 100X
5: Ensure that the tested end has a home power output
6: Connect the probe clip and probe to 2 wires of household electric power without
distinguishing the positive and negative pales
7: Press the [auto] button once to display the waveform of the household electric
power. If the waveform after automatic adjustment is too small or too large, the
waveform size can be adjusted manually by the knob
Power ripple measurement
Gear selection: if the output voltage of power supply is below 40V, it is set to the 1x
gear (both probe and oscilloscope are set to 1x gear), and 10x gear (both probe and
oscilloscope are set to the same gear if they are 40-400v}
1: Firstly, the oscilloscope is set to auto trigger mode (auto trigger mode is default
after startup), and auto trigger mode is used to test the cycle signal (DC voltage
belongs to the periodic signal)
2: The oscilloscope probe multiplier is set to the corresponding gear (default is 1x
after startup)
3: The oscilloscope coupling mode is set to AC coupling mode, note that AC AC
coupling mode
4: Insert the probe and move the switch on the probe handle to the corresponding
gear
5: Make sure the power is powered on and voltage output is available
6: Connect the probe clip to the negative extreme of the power output, and the probe
is connected to the positive extreme of the power output, and wait for about 3
seconds. When the yellow line and the left yellow arrow position are in the same
position, wait until the position is in the same position
7: Press the [auto] button once, and the power ripple will be displayed
Inverter output measurement
Gear selection: the output voltage of inverter is similar to that of household electricity,
with peak voltage above 500V, the highest measurement of 40V in 1X, 400V in
1 Ox and 4000V in 1 OOx gear. The default standard probe is 1 Ox hi g h voltage probe,
and the peak value of 400V can only be measured at the highest. Therefore, 100x
probe shall be provided by itself, and then set to 1 OOx gear, that is, both probe and
oscilloscope shall be switched to 1 OOx gear
1: Firstly, the oscilloscope is set to auto trigger mode (the default mode is auto trigger
mode after startup), and auto trigger mode is used to test the periodic signal (the
signal output by the inverter belongs to the pericolic signal
2: The oscilloscope probe multiplier is set to 100x (default is in the 1x gear after
startup)
3: Oscilloscope coupling mode is set to DC coupling mode
4: Insert the probe and move the switch on the probe handle to 100X
5: Ensure inverter is powered on and voltage output is available
6: Connect the probe clamp and probe to the output end of the inverter without
distinguishing the positive and negative poles
7: Press the [auto] button once to display the waveform of the inverter. If the
waveform after automatic adjustment is too small or too large, the waveform size can
be adjusted manually by knob
Measurement of power amplifier or audio signal
Gear selection: the output voltage of power amplifier is generally below 40V, and the
maximum test of 40V in the 1x gear is enough {both probe and oscilloscope are set
to the 1 x gear).
1: First set the oscilloscope to auto trigger mode {the default is auto trig ge r mode
after startup)
2: The oscilloscope probe multiplier is set to the 1x gear (default is 1x gear after
startup)
3: Oscilloscope coupling mode is set to AC coupling mode
4: Insert the probe and move the switch on the probe handle to the 1x position
5: Ensure that the amplifier is on and is outputting audio signals
6: Connect the probe clip and probe to the output end of 2 lines of the amplifier
without distinguishing the positive and negative poles
7: Press the [auto] button once to display the waveform of the inverter. If the
waveform after automatic adjustment is too small or too large, the waveform size can
be adjusted manually by knob
Measurement of vehicle communication signal J bus signal
Gear selection: the communication signal of automobile is generally lower than 20V,
and the maximum test for 1x gear is 40V, so it is enough to test the vehicle communication
signal with the 1x gear (both probe and oscilloscope are set to the 1x
gear).
1: Firstly, the oscilloscope is set to normal trigger mode (auto trigger mode is
default after startup). Normal trigger mode is specially used to measure the non
periodic digital signal. If Auto trigger mode is used, it is impossible to grasp the non
periodic signal
2: The oscilloscope probe multiplier is set to the 1x gear (default is 1x after startup)
3: Oscilloscope coupling mode is set to AC coupling mode
4: Insert the probe and move the switch on the probe handle to the 1x position
5: Connect the probe clip and probe to two signal lines of communication line,
regardless of positive and negative. If there are multiple signal lines, you need to
judge the signal line in advance, or try to select two of them for testing several times
6: Make sure that there is a communication signal on the communication line at this
time
7: Adjust the vertical sensitivity to 50mV
8: Time base to 20us
9: Press [50%] once
10: When there is communication signal on the communication line, the oscilloscope
will capture and display it on the screen. if it can not be captured, it is necessary to try
to ad just the time base (1 ms-100ms) and trigger voyage {green arrow) for multiple
times
Infrared remote receiver measurement
Gear selection: the infrared remote control signal is generally 3-5v, and the maximum
test for 1x gear is 40V, so it is enough to test the vehicle communication signal signa l
with the 1x gear {both the probe and oscilloscope are set to the 1x gear).
1: Firstly, the oscilloscope is set to normal trigger mode {auto trigger mode is
default after startup). Normal trigger mode is specially used to measure the non
periodic digital signal. If the auto trigger mode is not able to grasp the non periodic
signal, the infrared remote control signal belongs to the non periodic digital coding
signal
2: The oscilloscope probe multiplier is set to the 1x gear (default is 1x after startup)
3: Oscilloscope coupling mode is set to DC coupling mode
4: Insert the probe and move the switch on the probe handle to the 1x position
5: Connect the probe clip to the ground end (negative) of the infrared receiver board,
and the probe to the data pin of the infrared receiver
6: Adjust the vertical sensitivity to 500mv
7: Time base to 20us
8: Tum the trigger red arrow position to the left yellow arrow position and approximately
1 large grid distance
9: At this time, the infrared receive hair signal is sent by remate control, and the
waveform will appear on the oscilloscope
Measurement of amplification circuit with sensors (temperature, humidity,
pressure, hall, etc.)
Gear selection: generally, the sensor signal is relatively weak, about a few millivolts.
This small signal cannot be detected directly by oscilloscope. There is signal amplification
part on the main board of this sensor. When the output end of the amplifier is
found, the oscilloscope can measure the signal after being enlarged. It can be used in
the 1x gear (both probe and oscilloscope are set to the 1x gear)
1: First set the oscilloscope to auto trigger mode (the default is auto trigger mode
after startup)
2: The oscilloscope probe multipliers is set to the 1x gear (default is 1x after startup)
3: Oscilloscope coupling mode is set to DC coupling mode
4: Insert the probe and move the switch on the probe handle to the 1x position
5: Connect the probe clip to the ground end of the sensor motherboard (negative
power supply), find the output end of the amplification part, and connect the probe
to the output end
6: Adjust the vertical sensitivity to 50 mV
7: Adjust the time base to 500ms and enter the slow scan mode of large time base
8: Move baseline to bottom
9: If the signal line appears at the top, the vertical sensitivity shall be reduced, which
is 100mV, 200mV, 500mv, etc. in turn, when the updated signal on the right starts not
at the top (generally the best in the middle of the upper and lower part), the signal
received by the sensor can be detected.